
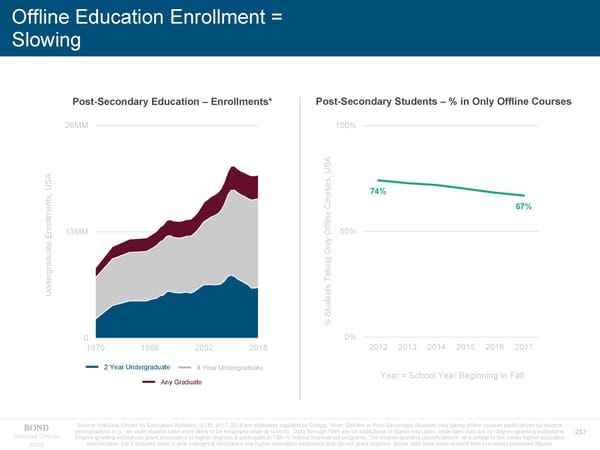
Offline Education Enrollment = Slowing Post-Secondary Education – Enrollments* Post-Secondary Students – % in Only Offline Courses 26MM 100% A US A , US es 74% , ts Cours 67% en m l ne i l f nrol 13MM f 50% O E te y nl O ng gradua i r ak T Unde ts en ud % St 0 0% 1970 1986 2002 2018 2012 2013 2014 2015 2016 2017 2 Year Undergraduate 4 Year Undergraduate Any Graduate Year = School Year Beginning in Fall Source: National Center for Education Statistics (3/18). 2017-2018 are estimates supplied by Chegg. *Note: Decline in Post-Secondary Students only taking offline courses partly driven by student demographics (e.g., an older student base more likely to be employed while at school). Data through 1995 are for institutions of higher education, while later data are for degree-granting institutions. Internet Trends Degree-granting institutions grant associate’s or higher degrees & participate in Title IV federal financial aid programs. The degree-granting classification is very similar to the earlier higher education 237 2019 classification, but it includes more 2-year colleges & excludes a few higher education institutions that did not grant degrees. Some data have been revised from previously published figures.
 Internet Trends 2019 - Mary Meeker Page 83 Page 85