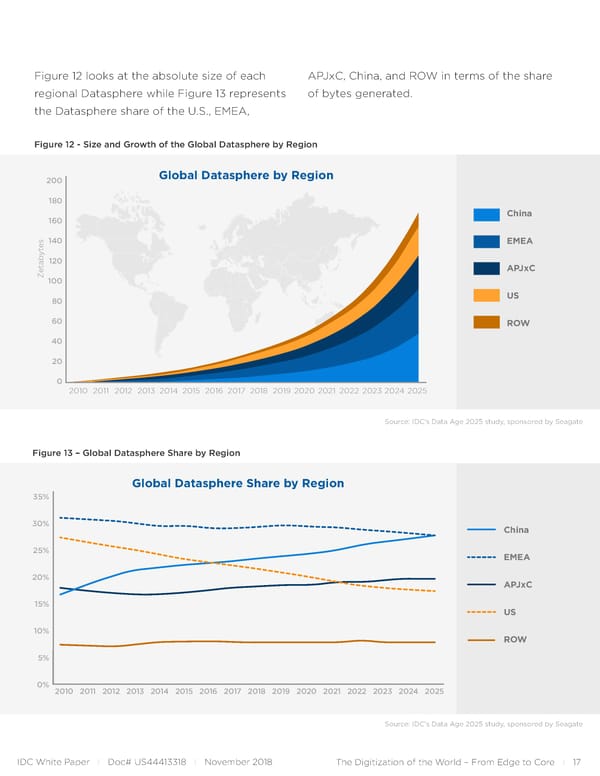
Figure 12 looks at the absolute size of each APJxC, China, and ROW in terms of the share regional Datasphere while Figure 13 represents of bytes generated. the Datasphere share of the U.S., EMEA, Figure 12 - Size and Growth of the Global Datasphere by Region 200 Global Datasphere by Region 180 160 China es140 EMEA yt 120 APJxC etab Z100 80 US 60 ROW 40 20 0 2010 2011 2012 2013 2014 2015 2016 2017 2018 2019 2020 2021 2022 2023 2024 2025 Source: IDC’s Data Age 2025 study, sponsored by Seagate Figure 13 – Global Datasphere Share by Region Global Datasphere Share by Region 35% 30% China 25% EMEA 20% APJxC 15% US 10% ROW 5% 0% 2010 2011 2012 2013 2014 2015 2016 2017 2018 2019 2020 2021 2022 2023 2024 2025 Source: IDC’s Data Age 2025 study, sponsored by Seagate IDC White Paper I Doc# US44413318 I November 2018 The Digitization of the World – From Edge to Core I 17
 The Digitization of the World from Edge to Core Page 16 Page 18